
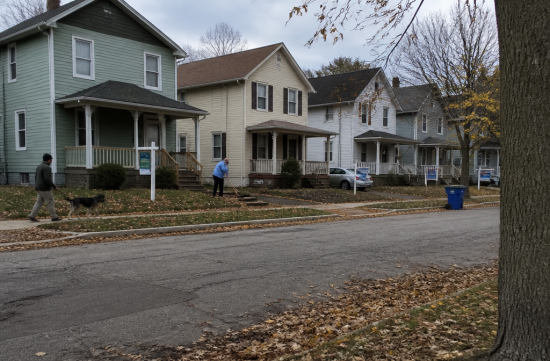
To summarize the Lansing market in one line: rents are nearly stagnant, while the increase in listings has provided some relief for buyers.
However, it's important to clarify that as of early November, the sales statistics for October have not yet been released. Therefore, I will base my analysis on the most recent data available from September.
Let's start with rents. According to updated data from RentCafe on October 30, the average rent for apartments in Lansing is $1,207.
This is a 1.39% increase compared to $1,191 a year ago. Considering the inflation rate, it can be viewed as effectively stagnant.
By unit type, the rents are as follows: studio $859, one-bedroom $1,042, two-bedroom $1,281, and three-bedroom $1,606.
When compared to other cities in Michigan, the differences are striking. Jackson has an average rent of $1,127, while Ann Arbor is at $2,092.
If someone moves from Ann Arbor to Lansing, they would save nearly $900 in average rent alone. This is a significant figure for those considering relocation for state government or university jobs.
One point to note is that rent statistics can vary widely between companies due to different sampling methods, leading to discrepancies of hundreds of dollars even within the same month.
RentCafe primarily focuses on large apartment complexes, so single-family home rentals or private listings may not be well represented. Therefore, if you are about to sign a lease, it's best to compare several current listings in your desired neighborhood for the most accurate information.
Now, let's look at sales. According to data from Realtor.com posted by the Federal Reserve Bank (FRED), the number of active listings in the Lansing-East Lansing metro area in September was 1,032.
This is an increase of nearly 200 listings compared to 847 in September of last year, representing an increase of over 20%.
Just in March of this year, the number of listings had dropped to 562, meaning it has nearly doubled in just six months. Given the prolonged drought of listings in the market, this change is quite significant.
The median listing price in September was $249,000, down from $272,125 in September of last year.
It's important not to misunderstand this. The listing price reflects the asking price of the properties on the market, not the actual sale price. If many lower-priced properties come onto the market, the median price may appear to decrease.
The actual sale prices can be seen in Redfin data. From January to June of this year, the average median sale price in the metro area was $228,653, which is a 3.5% increase compared to the previous year.
This indicates that prices were slightly rising in the first half of the year, but as inventory has piled up in the second half, the asking prices have started to decline. Whether actual sale prices will follow suit after September will depend on the data from October and November.
The speed of sales has also slowed down. The median days on market for listings in September was 46 days, which is over a week longer than the 38 days in September of last year.
The number of listings with reduced prices was 432, which is higher than the 380 from September of last year. This suggests that there is a growing atmosphere where sellers are finding it difficult to stick to their initial asking prices.
The interest rate situation remains heavy. As of October 29, the average 30-year fixed mortgage rate according to Freddie Mac was 7.24%.
This is slightly down from 7.32% the previous week, but compared to 6.17% a year ago, it is over a percentage point higher. This means that even for the same house, the monthly payment is definitely higher.
In conclusion, Lansing currently has an increasing number of listings and high interest rates. Buyers have more options, while sellers are facing longer wait times.
Conditions vary from neighborhood to neighborhood within the same metro area. The prices and the speed at which properties sell can differ significantly between areas like East Lansing or Okemos, which are influenced by school districts, and older neighborhoods in the city.
Relying on a single average number for the metro area to estimate your home value can lead to inaccuracies. It's advisable to check recent sales data for specific zip codes or school districts you are interested in.
If you are considering a purchase, now is a time when there is more room for negotiation than before. For properties that have been on the market for over 46 days, it may be worth asking for price reductions or repair conditions.
For rental investors, the calculations become a bit more complex. While rents are stagnant at around 1%, interest rates are in the 7% range, which could tighten cash flow if significant loans are involved.
From a tenant's perspective, this is not a bad time. With rent increases slowing down, there is now a basis for negotiating the increase during lease renewals.
In my opinion, there's no rush to buy, but it's also not a market to wait indefinitely. If interest rates drop, the increased inventory could be quickly absorbed again.
I would choose two or three neighborhoods I'm interested in and focus on properties that have been on the market for a while to evaluate conditions. Once the October sales statistics are released, I will reassess the numbers and provide an update.
 PeelStealth
 JiRunningMan






 silents |
 Choco Choco Star |

 gentle |
 neapolis |

 moo moo |

 stormee |

 vanillastorm |


 sugartrail |

 bloom |
 clarion |
 almondo |
 monkey |
 umbrellafruit |
 Porynix |
 San Gabriel Mountains |
 creamcat |
 victoria jung |
 Peter Pan Pet |
 Archaic Kim |
 Washington Denzel DJ |
 Fong Mr |
 espressotop |
 raviont |
 Illinois alpaca |
 Purple Moons, |
 Ted 600 |
 jaxter |
 garlic bread |