
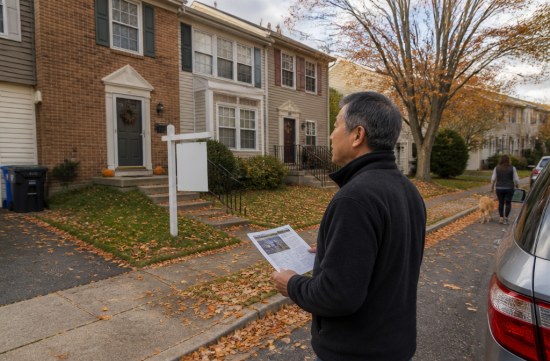
The median price of homes sold in Centerville in October was $625,000. This is based on MLS data from 43 transactions that closed between October 2 and 31.
While the number looks high, it is 4.9% lower than the $657,000 from the same period last year. The number of transactions also slightly decreased from 45 to 43.
The title mentions a comparison with September, but there is something to clarify first. Reliable figures for just the month of September vary across sources, making it difficult to present them accurately.
Therefore, I will compare the figures from the three-month period from early August to the end of October with the data for just October. This method tends to provide a clearer trend.
The median price for the three-month period is $615,000, which is a 3.2% increase compared to the same period last year. Since the October figure is $10,000 higher, it is hard to say that prices have dropped this fall.
For reference, the median price for the 60 transactions that closed in the 30 days leading up to August 1 was $576,000. This indicates that fall prices are actually stronger than those during the summer.
Looking at the 12-month cumulative data, the picture becomes clearer. The median price is $600,000, unchanged from a year ago, and the number of transactions is 670, down only 2%.
From my perspective as someone who has observed this market for a long time, this indicates stability. It is a market that is neither rising nor falling.
However, the pace has slowed a bit. The median days on the market for October transactions was 11 days, which is three days longer than the 8 days from a year ago.
Compared to the summer transactions that sold in a median of 7 days, there is a noticeable difference. The trend of listings selling over the first weekend has definitely eased.
The ratio of actual sales to listing prices is 99.51%, slightly down from last year's 99.70%. Given that the 12-month average was 100.47%, it seems that bidding wars have nearly disappeared.
The inventory of homes for sale as of November 1 is 99 listings. At the current pace, it would take 1.8 months to sell all of them, indicating that it is still a seller's market.
When looking at different types of homes, the situation varies significantly. The median price for single-family homes over the past 12 months is $890,000, which is a 0.6% increase.
Townhouses are at $550,000, down 1.8%. With 386 transactions, this is the most common type, so it can be said that the townhouse market is essentially driving the overall market sentiment.
Condos are priced at $348,500, which is a 4.0% increase. However, with a supply of 2.5 months, buyers have the most options in this category.
Differences by zip code are also noteworthy. The 20120 area has a 12-month median price of $634,000, down 4.7%, while the 20121 area is at $550,000, down 2.0%.
Even within the same neighborhood, prices can vary significantly based on school district assignments and housing composition. This is why I always advise checking the zip code and school assignments before the neighborhood name when looking at homes.
Now, let's move on to rentals. According to updated data from Zumper on November 2, the overall median rent in Centerville is $2,650 per month.
This is a 3.1% increase from a month ago, and there is no change compared to a year ago. It seems that rents, which were reported to be declining earlier in the year, have stabilized this fall.
By bedroom count, two-bedroom units are at $2,410, unchanged from last month, while three-bedroom units are at $2,800, down 3% in a month. I won't cite the one-bedroom figures this time due to a small sample size.
Rental data is based on listed asking prices, so there may be discrepancies with actual contract prices. It's safer to check multiple sources rather than relying on just one.
So what do these numbers actually mean? For buyers, there is a bit more flexibility compared to last year.
With listings staying on the market for over ten days and sales occurring below asking prices, there is now room to negotiate conditions or request closing cost assistance. This is a shift from a few years ago when buyers had to concede all terms.
For sellers, it is important to set realistic prices from the start. If there is no response within the first two weeks, the room for negotiation widens significantly afterward.
Those looking to invest in townhouses should be meticulous with their calculations. A $550,000 home with a rent of $2,650 may yield tight cash flow depending on financing conditions.
In my opinion, this area is neither a rush-to-buy nor a wait-and-see market. If you find a home you like, it is advisable to negotiate thoroughly before proceeding.
This sales data is based on a report compiled from local MLS data as of October 31. Please keep in mind that different sources may have varying figures due to differences in regional boundaries and aggregation methods.
Once November transactions are finalized, I will compile the data again to include year-end trends. Given that this is a season when transactions typically decrease, it will be interesting to see how much the days on the market increase.
 JellyUpMan








 silents |
 Choco Choco Star |
 gentle |
 neapolis |

 moo moo |

 Maria Mom |

 brandon |

 Victormon |

 victoria jung |

 Virginia Butterfly Mom |
 clarion |
 almondo |
 monkey |
 umbrellafruit |
 Porynix |
 San Gabriel Mountains |
 creamcat |
 Peter Pan Pet |
 Archaic Kim |
 Washington Denzel DJ |
 Fong Mr |
 vanillastorm |
 espressotop |
 raviont |
 Illinois alpaca |
 Purple Moons, |
 Ted 600 |
 jaxter |
 garlic bread |