
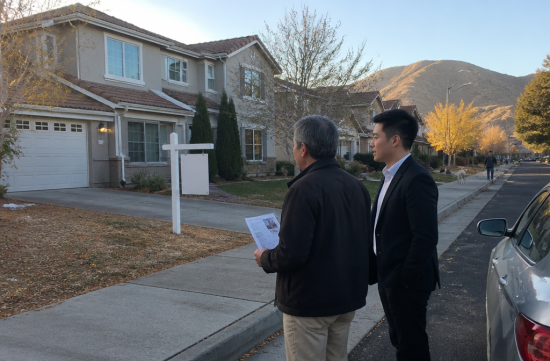
Reno rent has increased by 7.3% over the past year. During the same period, the national average rose by only 0.1%, while the overall rate in Nevada actually decreased by 0.9%.
This data is from the November report by Apartment List, based on figures from October. I double-checked the numbers when I first saw them.
This report organizes information on rent, inventory, listing prices, and interest rates. However, please note that the reference points vary for each category.
Rent and mortgage rates are available up to October. The inventory and listing prices I compiled are based on data from FRED, which is current only through September, so I will use September figures.
According to Apartment List, the overall median rent in Reno is $1,467, which is 6.0% higher than the national average of $1,384.
By bedroom type, a one-bedroom apartment costs $1,212, while a two-bedroom costs $1,518. Nationally, these figures are $1,215 and $1,369, meaning the one-bedroom is comparable to the national average, but the two-bedroom is significantly more expensive.
In October, Reno saw a 0.2% increase, while the national average dropped by 0.3%. Typically, rents ease in the fall, but they did not decrease this year.
From January to October, the cumulative increase is 8.6%, noticeably higher than last year's 5.1% during the same period.
Rent prices vary significantly depending on the source. Zumper reports one-bedroom rents at $1,375 and two-bedrooms at $1,749, while RentCafe averages $1,832.
Since the samples and calculation methods differ, it's not accurate to say one is wrong. The key point is the trend compared to the previous year.
Zumper shows a 6% increase for one-bedrooms and a 9% increase for two-bedrooms, while RentCafe reports a 5.92% increase. All three sources indicate an upward trend, so the increase itself can be trusted.
If you are planning to move, I recommend comparing the actual listing prices in your desired neighborhood against the average values. The difference for two-bedrooms alone is $231 between the two sources.
Shifting to sales, there were 1,499 active listings in the Reno metropolitan area in September, down 16.4% from 1,793 in September of last year.
This data is compiled by Realtor.com and published by FRED. There were also 612 new listings, which is 4.1% fewer than last year's 638.
After dropping to 1,075 in February, the numbers have been gradually recovering, but they still haven't reached last year's levels.
The median listing price in September was $645,450, which is a 0.5% increase compared to last year's $642,000, indicating that prices are essentially stable.
This year's peak was $687,575 in June, representing a 6.1% decrease over three months, likely influenced by the seasonal trend of lower listing prices as fall approaches.
Looking back, the median listing price in September 2019 was $439,916. This means current prices are 46.7% higher, so from a long-term perspective, this adjustment doesn't seem significant.
The average time on the market is 54 days, which is 12 days shorter than last year's 66 days. There are 646 price-reduced listings, accounting for 43.1% of active listings.
This is higher than last year's reduction rate of 38.5%. While homes are selling faster, the proportion of homes reducing their prices has also increased, indicating a market where homes listed at fair prices are distinguishing themselves from those that are not.
One important note: listing prices are not the same as actual sale prices.
The median sale price for October was not available in the data released this time, so I did not include transaction figures.
However, according to the Federal Housing Finance Agency (FHFA) housing price index, the Reno index for Q2 2026 is 413.50, which is 3.8% higher than last year's 398.53, so it's still too early to say that prices have peaked.
The most significant movement in this market has been in interest rates. According to Freddie Mac, the 30-year fixed mortgage rate was 7.24% on October 29, up 1.07 percentage points from 6.17% a year ago.
On October 8 and 15, rates rose to 7.40% before slightly decreasing. The 15-year fixed rate is at 6.60%.
Let's calculate based on a 20% reduction on a median-priced home from September. With a loan of $516,360, the monthly principal and interest would be $3,519, compared to $3,152 at last year's rate, resulting in a difference of over $360 each month.
This amount excludes property taxes and insurance. This is a simple calculation assuming the listing price remains the same, so please consider it as a reference only.
In October, the two-bedroom rent was $1,518 according to Apartment List and $1,749 according to Zumper. While the types of homes differ, it's significant that the mortgage payment exceeds the rent by more than double.
Employment is not bad. The unemployment rate in the Reno metropolitan area was 3.5% in September, down from 4.3% in September of last year.
To add my interpretation: it seems that those who would have bought are staying in rentals due to high interest rates, while landlords with lower rates are holding onto their properties, resulting in both rents and listing prices remaining stable.
If I were to buy a home now, I wouldn't rush. However, it would be worth considering negotiating for homes that have been on the market longer and have reduced their prices.
If you're looking to invest, the high interest rates make it unwise to enter the market based solely on rent increases. It's essential to first align the actual monthly burden with the two-bedroom rent.
 Smart Yo







 Dr. Kelso |

 silents |

 Choco Choco Star |
 gentle |
 neapolis |

 zoryan |


 Nevada Teppanyaki |


 Noodle Noodle |
 Anjollinya Blog |
 Texas Migration Story |
 Elastico |
 peltra |
 banleaf |
 humpday sonata |
 silver |
 Queens Blues |
 Christopher |
 timemachine |
 frostpup |
 Non-Stop Squat Team |
 laughing |
 sweetvan |
 lattepop |
 Augusta Univ |
 Well Done Sir |
 nrixa |