
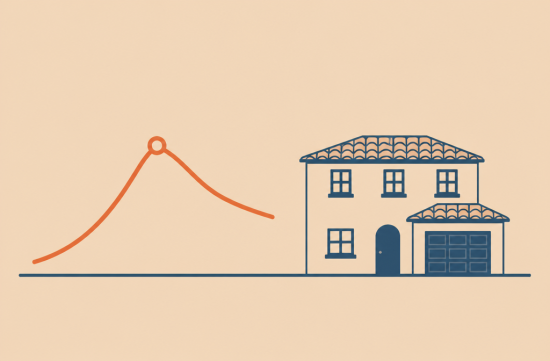
As I gathered data to summarize the Rancho Cucamonga market for October, the most significant change was not in home prices or rent. It was in mortgage rates. Home prices and rent remained quieter than expected, and it seems the rates drove the overall sentiment.
First, let me clarify the basis for this information. This article is based on data released as of November 12. The mortgage rates are from Freddie Mac's weekly survey, rent data is from the Apartment List November report, and home prices are referenced from Zillow and Property Focus data.
The average 30-year fixed mortgage rate from Freddie Mac was 6.71% in the first week of September. However, it rose to 7.28% on October 1, reaching 7.40% on October 8 and 15.
After that, it gradually decreased. On October 22, it was 7.32%, and on the 29th, it was 7.24%, with the November 5 announcement showing 7.18%.
A year ago, the same week had a rate of 6.22%, which means it is nearly 1 percentage point higher now. For those who were waiting for rates in the low 6% range around this time last year, this is quite a painful number.
To put this into perspective, I did a calculation. If you borrow $600,000 on a 30-year fixed mortgage, the principal and interest payment would be $3,876 at 6.71% and $4,154 at 7.40%.
This means an increase of nearly $280 in monthly payments within just one month. This amount excludes property taxes and insurance, so the actual difference feels even larger.
With such a change, it's natural for potential buyers to pause. In the past, when rates spiked quickly, showing appointments decreased, and I believe this time will be no different.
So, what about home prices? To be honest, there are no official figures yet for the median sales price for the entire month of October.
The California Association of Realtors (C.A.R.) typically releases its October sales report around mid-November. Therefore, be cautious of articles claiming that home prices increased or decreased by a certain percentage for October at this point.
However, there are some data points that can indicate trends. Property Focus reported that the median price for single-family homes based on transactions over the past year was $765,000 as of October.
The same site shows a median price of $776,500 for November. However, this is based on a 12-month cumulative average, so it should not be interpreted as a $10,000 increase for just the month of October.
Zillow's Home Value Index was $788,806 at the end of July, which is down 0.5% from a year ago. It can be considered relatively stable, with neither significant drops nor increases.
County data is also worth noting. According to C.A.R. data, the median price for single-family homes in San Bernardino County in August was $522,370, which is 4.2% higher than a year ago.
Rancho Cucamonga has historically been much more expensive than the county average. The influence of school districts and new developments is significant, and that gap is not easily closed.
The changes felt on the ground are more about negotiations than price tags. When rates exceed 7%, it's common for sellers to offer rate buy-downs or closing cost credits.
In the past, homes that received multiple offers at listing prices now often move only after price adjustments. This is why you shouldn't judge market value based solely on asking prices.
Now, let's move on to rent. According to the Apartment List November report, the overall median rent in Rancho Cucamonga is $2,139.
During October, it decreased by 0.4%. It can be considered nearly the same level as last month.
Compared to a year ago, it has increased by 2.2%. The national average increase reported in the same report was 0.1%, so rents in this area remain relatively strong.
The overall median rent in the Riverside metropolitan area is $1,880, with an annual increase of 2.1%. Chino Hills, right next door, has the highest rent in the region at $2,953, with the highest increase rate of 3.9%.
In contrast, Fontana had the smallest annual increase at 1.1%. Even within the Inland Empire, there are significant differences between neighborhoods.
For reference, these figures are centered around apartments. Single-family home rents can reach the mid-$3,000 range on various sites, so those looking for homes should definitely differentiate by housing type.
To summarize, interest rates peaked in mid-October and are now on the decline. Home prices are stable, while rents have seen a slight monthly decrease but a gradual annual increase.
If you are considering buying, there are a few things to check. Get quotes from two or three lenders on the same day, and be sure to ask about seller credit negotiation possibilities. It's best to look at recent sales prices from the last three months rather than just the asking price.
If you are looking for rent, winter's off-peak season can be a good time for negotiations. Asking for rent adjustments or move-in incentives under the condition of a longer lease term can also be a strategy.
If your goal is investment, it's challenging to match cash flow with rental income at rates in the 7% range. When you compare rents in the $2,100 range with monthly payments exceeding $4,000, the answer becomes clear.
Personally, I wouldn't rush into anything right now. I would wait until mid-November when the official sales statistics for October are released and see if rates drop below 7% before making a move.
From my experience observing this area for a long time, I've noticed that those who make hasty decisions when rates fluctuate often end up regretting it the most. It's sufficient to verify each number as they come out one by one.
 SlavoBravo
 silver84







 B.I.G. Victor |

 Amber H |
 uplifted |

 Dr. Kelso |

 silents |

 CA Real Estate |


 San Gabriel Mountains |


 Lifestyle Information Search USA |

 Experiences Living in America |
 strawberry |
 US Regional Information Local News |
 USA Business News |
 Blondee |
 E whisper |
 Potato House |
 freshmint |
 Ansaso |
 Golado |
 babybay |
 honeycom |
 French Macarons |
 Exploring American Life Information |
 Sunshine Blog |
 Community Cross |
 Sayonara H |
 What can make money? |
 Information Search LifeMAN |
 morvex37 |
 neontrail |