

In mid-August, the Texas Education Agency (TEA) announced the A-F school ratings for 2026. There has been quite a bit of talk around here about how our kids' schools scored. I also opened up the numbers first.
The headline is this: 24% of the districts and campuses that received ratings improved from last year. That means roughly 1 in 4 schools moved up at least one grade level.
The scale is not small either. This year, 1,202 districts and 9,105 campuses were evaluated. There were also 560 campuses that remained Not Rated.
Looking at the distribution of ratings, 28% received an A, 29% a B, and 28% a C. D received 9%, and F received 6%. The percentage of schools rated C or above, which TEA considers acceptable, is 85%.
It was also notable that 585 campuses that were below an A last year moved up to an A this year. Honestly, I was a bit surprised by how many there were.
The data I have been following the longest is about schools with a high percentage of low-income students. Among these high-poverty campuses, the percentage that received an A or B increased from 47% last year to 49%. The percentage of F ratings decreased.
A 2 percentage point increase may seem small. However, I believe it is significant that the direction is positive. After all, these are the schools that need investment in public education the most.
So, what are these ratings based on? They look at three areas: Student Achievement, School Progress, and Closing the Gaps.
The first is how much students have reached grade level. The STAAR test results are central, and for high schools, indicators of graduation or readiness for further education are also included.
The second is growth. They assess how much students have improved over the year and how they compare to similar schools.
The third is the gap between student groups. They evaluate how well groups like English learners or low-income students are performing.
The calculation method is interesting. The higher score between achievement and growth accounts for 70%, while the gap area accounts for 30%. This structure allows schools starting from a lower baseline to be recognized for their growth.
I also summarized the results for the El Paso area. These numbers were cross-verified with local media reports and district announcements.
El Paso ISD received a B with a score of 82. 39 campuses received an A or B, with 13 of them earning an A.
What stands out in EPISD is Guillen Middle School and Murphee PK-8. Both jumped from an F to a B. This must have been quite welcome news for parents.
Ysleta ISD scored 88, also a B, with 25 out of 48 campuses receiving an A. It is reported that for the first time in district history, all high schools received an A.
Socorro ISD scored 87, a B. Out of 51 campuses, 18 received an A, and there were no D or F ratings.
From the numbers, it appears that most of the major districts in El Paso are clustered in the B range. Local media has noted that they have managed to raise scores despite financial pressures.
Clint ISD scored 86, a B, while Canutillo ISD scored 78, a C. The highest score at the campus level was 98 from Valle Verde Early College High School.
I want to point out one thing here. The improvement in ratings is certainly good news. However, this system places a heavy emphasis on test scores.
Aspects that cannot be quantified, such as music, counseling, and special education support, are hardly reflected in the ratings. Therefore, I view the A-F ratings more as a first filter rather than a complete report card for schools.
There has also been conflict surrounding the ratings. In 2023, over 120 districts filed lawsuits against TEA's changes in criteria, causing delays in the release of ratings.
On the flip side, it is also true that the stakes are high. If a campus receives an F repeatedly, the state government can intervene. This could lead to school closures or changes in the district board.
So, what can parents do? The easiest thing is to visit TXschools.gov. By entering your home address, you can compare your assigned school with nearby schools on a map.
Don't just look at the overall ratings; be sure to check the scores in each area. If a school has low achievement but high growth scores, it could be a sign that they are on the right track.
It's also worth checking the Closing the Gaps results for the group your child belongs to, especially if they are learning English.
If you're curious about the numbers, asking the school directly is also an option. During fall parent-teacher conferences, asking what has changed compared to last year usually gets a sincere response.
If it were me, I would look at the growth scores and group results alongside the rating sheet. I also recommend visiting the school in person. Data is just a starting point, not a conclusion.
That 1 in 4 schools improved is definitely good news. I plan to keep an eye on whether this trend continues for low-income schools and what the numbers will look like next year.
 SaltCityHunt








 Vacation on Hawaii |
 morvex37 |
 Ari Songhan American Immigration Life |
 Bearded Strawberry Smoothie |
 Heart Ticker |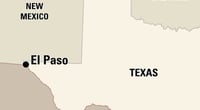
 Tomex Train Uncle |
 hexon |
 tredon |
  Spicy Immigration Life |
 clarion |
  zenvor16 |
  The 2000 |
  toclick |
  wexlin84 |
  Hairy Poppins |
  daisypat |
  Taco Bell Candy Note Blog |
  MintO |
  My Town My Way Blog |
  New Mexico Friends MAX |
  Hajiwon Blog Hair Salon |
  Wicked - Fireyo |
  Seattle - Emerald City |
  new noah |
  xylora |
  Anjollinya Blog |
  total solution |
  valtri |