
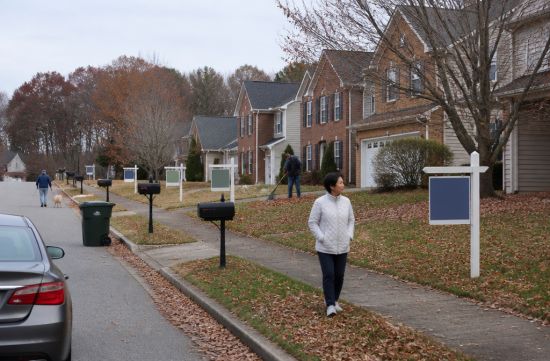
To summarize the Atlanta market in October: rents are steady, interest rates are back in the 7% range, and inventory is piling up. Looking at the numbers one by one, significant changes are happening within a seemingly quiet market.
First, let me clarify the reference points. For rents, I used the November report reflecting October data from Apartment List, and for home prices, I referenced the September brief released on October 19 by the Atlanta Realtor Association based on FMLS data.
The sales statistics reflecting October transactions typically come out around mid-next month. Therefore, you can consider the home prices in this article as the most recent official figures from September.
Starting with rents, the median rent for the entire city of Atlanta is $1,535 according to Apartment List.
In October, it decreased by 0.4%, and over the past 12 months, it only increased by 0.3%. Essentially, it has remained at the same level for a year.
When looking at the metro area as a whole, the median rent is $1,451, with an annual increase of 0.1%. Compared to the national median of $1,384, Atlanta's city rent is 10.9% higher.
The national trend is similar. During the same period, national rents decreased by 0.3% in a month and increased by 0.1% over the year. This indicates that the weakness is not unique to Atlanta but reflects a broader slowdown in the rental market across the U.S.
There are still significant regional differences. The most expensive area in the metro for rent is Johns Creek, with a median of $2,059, while the cheapest is Conyers at $1,171.
It remains true that the northern neighborhoods, popular among Korean families due to school districts, are at the top. However, unlike in previous years where annual increases were expected, the rate of increase has noticeably slowed down.
The area with the highest annual increase was Douglasville at 4.5%, while the largest decrease was in Stone Mountain at -4.9%. It's worth noting that even within the same metro area, trends can diverge.
The reason rents are stagnant is due to supply. The influx of new apartments built over the past few years is still being absorbed, limiting landlords' ability to raise prices.
According to Yardi Matrix data, the number of completed units by June this year was 2,814, showing a significant slowdown. However, there are still 23,011 units under construction, suggesting that tenant advantages are likely to continue for the time being.
Now, regarding home prices. The median sale price for the 11 counties in the metro area in September was $416,000, which is a 1.5% increase from a year ago.
The average sale price is $544,500, reflecting a 3.8% increase. The fact that the average has risen more than the median indicates that high-end home sales have held up relatively well.
The atmosphere is somewhat different compared to a month ago. The median sale price in August was $423,000, and it had risen to $442,500 in June.
It's common for prices to stabilize after the summer peak season. Therefore, I believe it's premature to conclude that home prices have turned downward based on this decline.
What I find noteworthy is the transaction volume. In September, the number of transactions was 3,680, which is an 18.5% decrease from a year ago. Compared to August's 4,157, there was a noticeable drop within just one month.
Conversely, inventory is piling up. The number of listings on the market has increased by 6.7% to 21,053, and the months of inventory has lengthened to 4.9 months, up from 4.7 months in August.
New listings have decreased by 1.6% to 7,531. Sellers are not rushing, and buyers are hesitating more.
The average time on the market has increased to 30 days, longer than the 27 days in August. In the past, multiple offers would come in after a single weekend open house, but now it has become common for properties to stay on the market for about a month.
This month's biggest issue is indeed interest rates. According to Freddie Mac's weekly survey, the average for a 30-year fixed mortgage was 6.71% on September 3, rising to 7.40% on October 8 and 15.
It then slightly decreased to 7.32% on October 22 and 7.24% on October 29. However, considering that it was 6.17% at this time last year, the burden is quite significant.
The sharp decline in September transactions is ultimately linked to this trend in interest rates. Since it peaked at 7.40% in mid-October, I believe that October transaction statistics will also not show significant improvement.
So, what should you do now? If you are a tenant, now is a good time to negotiate. Rather than accepting the increase during renewal, I recommend comparing it with the conditions of nearby new complexes.
If you are looking to buy a home, you can take advantage of the increased inventory and longer selling periods. Don't just focus on the price; consider asking for closing cost assistance or rate buy-downs as part of your offer.
If you are investing, you need to be conservative in your calculations. With rent growth at around 0% and loan rates hovering above 7%, it's challenging to maintain cash flow solely from rental income.
From my observations, in such stagnation periods, the impatient often end up losing. It's better to wait for rates to drop while getting pre-approved and studying the neighborhoods in advance.
In mid-November, the FMLS brief reflecting October transactions will be released. At that time, I will reassess whether transaction volumes have bottomed out and if the increase in inventory continues.
 OrionOregon








 Choco Choco Star |

 gentle |
 neapolis |

 moo moo |

 ultron78 |

 Dingho and USA News |

 Let's Be Like a Salt-like City Person |

 Gimmi207 Blog |

 Cherokee Rose |

 Alaska Salmon Buyer |
 solvix18 |
 California Information News |
 HAWAII Korean Church News |
 Raomi News |
 My Love DS |
 Hardworking CPA |
 People Moon |
 Carolina border |
 korian87 |
 dancing in the rain |
 bravo777 |
 yolo1990 |
 Valley Hong |
 zentra95 |
 wishi |
 abox |
 Belgray Miscellany |
 Spaghetti Pasta Fan |
 softmoony |