
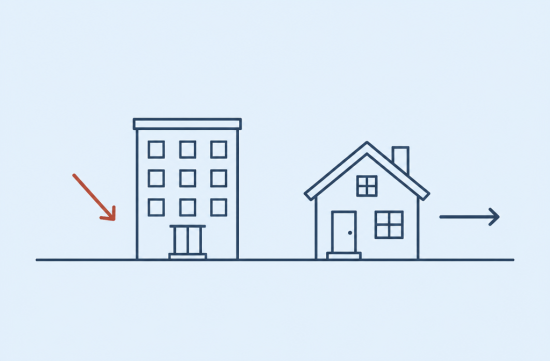
When I first received the rental numbers for Fargo in October, I was puzzled. One site reported a decrease over the month, while another claimed it had increased compared to a year ago.
To put it simply, neither statement is entirely wrong. It all depends on what, when, and how the measurements were taken.
First, let's look at the rent. According to Trulia, the average monthly rent in Fargo dropped from $959 in September to $929 in October, a decrease of $30.
This translates to a decline of just over 3%. This is a significant change for just one month. It coincides with the time of year when moving demand typically decreases as the weather gets colder.
The recent peak in the same data was $1,003 in December 2025. Compared to that, the October figure is more than $70 lower.
However, when looking at data from RentCafe, the picture changes. As of October 30, the overall average rent in Fargo is reported to be $1,180, which is a 3.47% increase from $1,141 a year ago.
By bedroom type, the average rent for a one-bedroom is $1,011, while a two-bedroom is $1,192. Studios are at $826, and three-bedrooms are reported at $1,567.
According to Zumper, the median value as of November 8 is set at $1,240, which is 8% higher than a year ago.
Interestingly, the numbers by bedroom type are quite similar. Zumper reports $1,012 for a one-bedroom and $1,189 for a two-bedroom, which closely aligns with RentCafe's figures.
This means that when comparing similar-sized apartments, the two data sources do not significantly diverge. The difference arises from how many listings each source includes.
The notably low average from Trulia seems to stem from the same reason. Since the composition and methodology of the listings differ, it's best to refer to the direction rather than the absolute amounts.
In the past, many people would base their market analysis on a single rental data point. Now, with the numbers varying so much across sites, it's essential to compare two or three sources side by side.
In summary, monthly figures show a slight dip in asking prices in line with the fall off-season, while annual figures remain higher than last year.
For reference, the fair market rent set by the Department of Housing and Urban Development is not the market rate but rather a standard for housing assistance. It's safer not to mix it with rental comparison data.
Now, let's discuss home prices. There is one important point to clarify here.
As of mid-November, the publicly available sales statistics mostly reflect data only up to September. The October transaction data is still being compiled, so it's premature to definitively state the October sale prices.
According to Redfin's three-month cumulative data, the median sale price in Fargo from July to September was $312,851, with 403 homes sold during this period.
In the preceding period from June to August, the median was $315,000. This is a decrease of just over $2,000, so it's more accurate to view it as stable.
The Zillow Home Value Index was $321,568 as of September. This figure represents the estimated value of all homes in the area rather than the median of actual transactions, which is why it appears slightly higher than Redfin's number.
We should also consider the speed of sales. The median days on market according to Redfin from July to September was 27 days, which is three days longer than the 24 days from June to August.
During the same period, active listings increased slightly from 794 to 805. An increase in inventory and longer selling times is a common sight in the fall market.
Therefore, to understand how home prices moved between September and October, we will need to wait for data to be released at the end of this month. Based on current trends, there is little evidence to suggest significant changes.
When comparing rent and sales, the characteristics are quite different. Rent fluctuates with the seasons, while sale prices are moving within a narrow range in the low $300,000s.
If you are a tenant, now is not a bad time to negotiate. During a period of declining asking prices, there may be room to ask for first-month discounts or adjustments to management fees.
If you are looking to buy a home, keep an eye on properties that have been on the market for a longer time. Homes that have been listed for a while tend to have more flexible pricing discussions. However, you should verify whether the extended time on the market is due to the condition of the home.
If you are investing, you need to factor in both the annual increase in rent and the monthly decrease. If you don't consider the winter vacancy period, your returns may end up being lower than expected.
When reviewing numbers, always check the reference point and the method of aggregation first. Even for the same October rent, the results can vary depending on whether it's an average, median, asking price, or contract price.
Personally, I would use the bedroom-specific numbers from RentCafe and Zumper for rent, and the three-month cumulative figures from Redfin for sales. A three-month trend is much less volatile than a one-month spike or drop.
Once the confirmed October sales figures are released, I will compare and summarize again. It's usually less risky to wait an extra month rather than make hasty judgments.
 MonMonFri
 OrangeDream








 B.I.G. Victor |

 Amber H |
 uplifted |

 Dr. Kelso |

 silents |

 General Knowledge Blog |

 North Dakota Ragdoll Cat Owner |
 reliable |


 strawberry |
 US Regional Information Local News |
 USA Business News |
 Blondee |
 E whisper |
 Potato House |
 freshmint |
 Ansaso |
 Golado |
 babybay |
 honeycom |
 French Macarons |
 Exploring American Life Information |
 Sunshine Blog |
 Community Cross |
 Sayonara H |
 What can make money? |
 Information Search LifeMAN |
 morvex37 |
 neontrail |