Long Beach receives significantly less rain compared to other coastal cities in California.
On average, there are only about 40 days of rain throughout the year, which means you can expect over 300 days of clear, sunny skies!
The rain here is strictly seasonal.
It mainly falls from late autumn to winter and early spring, and you can expect to rarely need an umbrella in the summer. However, occasionally, the 'El Niño phenomenon' reported in the news or unpredictable 'monsoon season' can bring sudden heavy rain, so it's wise to check the weather forecast from time to time.
Monthly Average Rainfall at a Glance
Let's take a look at how much rain falls each month in inches. The numbers clearly show the climate characteristics of Long Beach.
January: about 2.5 inches
February: about 3.0 inches (the wettest month of the year!)
March: about 2.5 inches
April: about 1.0 inch
May: about 0.5 inches
June: about 0.1 inches
July: about 0.0 inches (it's hard to see even a drop of rain)
August: about 0.1 inches
September: about 0.2 inches
October: about 1.0 inch
November: about 1.8 inches
December: about 2.5 inches
Weather Changes in Long Beach by Season
Winter (December - February): Umbrella Season
This is the season when you're most likely to encounter rain in Long Beach. February has the highest average rainfall at 3.0 inches. During this time, due to the coastal area's characteristics, strong winds can accompany thunderstorms, so be sure to bring a warm coat and a sturdy umbrella when visiting Long Beach in winter.
Spring (March - May): Gradually Clearing Skies
Until March, there is a fair amount of rain at about 2.5 inches, and occasionally strong thunderstorms can occur due to the monsoon's influence. However, as you move into April and May, the rain noticeably decreases, leading to the pleasant and dry spring weather typical of California. It's a beautiful time for outdoor activities.
Summer (June - August): Perfect Beach Season
As seen with July's rainfall at 0.0 inches, Long Beach's summer is characterized by extremely dry weather, almost akin to a drought. With low humidity, it feels cool and very pleasant in the shade. Rarely, short and intense rain showers may occur due to the monsoon climate, but for the most part, the weather is perfect for surfing and swimming every day.
Autumn (September - November): Raindrops Return
Until September, the summer's warmth lingers, keeping things dry, but as October and November approach, rain forecasts begin to increase. Especially during the autumn monsoon, there can be sudden increases in rainfall, marking the season as a time to prepare for the approaching winter.
What Was the Rainiest Day in History?
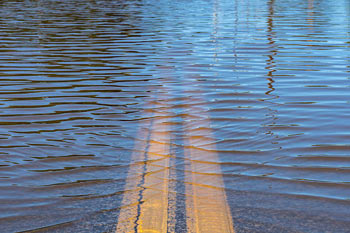
Even in the peaceful and sunny Long Beach, there was a time when an extraordinary downpour made history. In January 1995, a record winter storm hit the city, bringing an astonishing 5.6 inches (about 142mm) of rain in a short period. Since this city typically doesn't receive much rain, the drainage system struggled to cope, leading to flooded roads and significant flooding and inundation damage, surprising the residents and marking a historic event.
In conclusion, Long Beach is a blessed city where you can enjoy clear and sunny weather for most of the year. As long as you take care during the few winter months, you won't have to worry about weather-related stress in this attractive neighborhood!


 ultron78 |
 heartwarming |
 CA Real Estate |
 lumix88 |
 US Regional Information Local News |
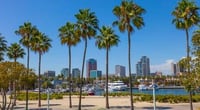
 Fong Mr |


 Korean Blog |
  Kitchen Ideas |
  Sandiego Auntie |
  Baguette Blog |
  Illinois alpaca |
  International Court |
  Samsung My My |
  heeve |
  Forest Gump |
  Life in the US |
  TEXAS Fishing Boat |
  silver |
  glenix39 |
  Young Kim and Cheol's Blog |
  RV Samuel's Dad |
  Seattle - Emerald City |
  AH LALA |
  Alaska Kim |
  vegas mom |