
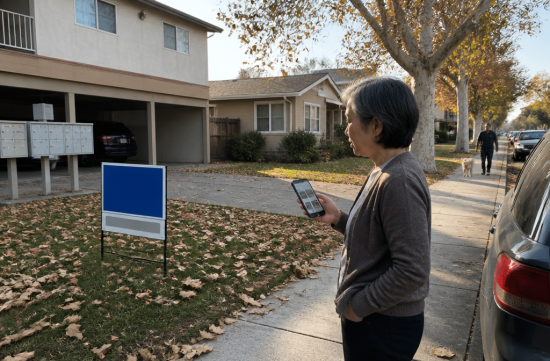
In the last week of October, Freddie Mac reported that the average 30-year fixed mortgage rate was 7.24%. While this is the lowest figure this month, it is still over 1 percentage point higher compared to 6.17% at the same time last year.
When looking at the San Jose market, I consider four factors simultaneously: interest rates, sales prices, rents, and regulations. Focusing on just one can easily skew judgment. Based on the data from October, let's examine each factor in order.
First, the trend in interest rates. According to Freddie Mac's weekly survey, the rates were 7.28% on October 1, 7.40% on the 8th and 15th, 7.32% on the 22nd, and 7.24% on the 29th.
The rates rose at the beginning of the month and then gradually decreased towards the end. However, it is too early to interpret this as a shift towards declining rates. I have seen too many cases where short-term movements led to incorrect conclusions.
Next, let's look at sales prices. According to Redfin's data, the median sales price from July to September was $1.3 million, which is 5.0% lower than the same period last year.
The time it takes to sell a home also increased, with a median of 22 days, up from 20 days last year. While this may seem like a small change, it signals that sellers are not as rushed as before.
There is also data for the entire metro area for just September. The median price was $1.55 million, down 3.4% compared to the previous year, with homes staying on the market for an average of 18 days.
Sales data can vary between city and metro levels, as well as between three-month and one-month aggregates. This is why different articles report varying home prices in San Jose, so it's important to check the range and period when looking at the numbers.
The trend in the first half of the year was similar. The average monthly median from January to June was $1,575,131, down 3.4% from the previous year, with 1,025 transactions during this period.
In the past, the idea of falling home prices in San Jose was unusual. Now, with adjustments continuing for over six months, it seems the market dynamics have changed somewhat.
However, the term "crash" is not accurate. The decline is in the low single digits, and transactions are still occurring within about three weeks. Zillow even identified the San Jose area as one of the hottest markets this year, indicating that demand remains strong.
Now, let's discuss rents. According to Trulia's monthly data, the average rent in the city was $2,895 in April, $3,000 in May, and $3,200 in July, showing a steady increase throughout the summer.
As of May, the average rent for a one-bedroom was $2,350, which is 61% higher than the national average. This clearly illustrates the burden on renters.
Data from Costa shows even higher figures based on listing prices. The average asking rent for December 2025 is projected to be $3,740, up 3.5% from the previous year.
While sales prices are gradually decreasing, rents are either holding steady or increasing. It's reasonable to interpret that demand for rentals remains as buyers delay purchases due to the 7% interest rates.
So, how much can rents increase? This is the most frequently asked question from the Korean community lately, and it's a topic I want to highlight this month.
The rent control ordinance in San Jose applies to buildings constructed and first rented before September 7, 1979, which are three or more generations old. The city estimates there are about 38,000 units affected.
These buildings can only increase rent by 5% once a year. Originally set at 8%, this cap was lowered to 5% by a 6 to 5 vote in the city council and has remained in place since.
For homes not covered by this ordinance, state law AB 1482 must be checked. The principle is to add the local inflation rate to 5%, but the total cannot exceed 10%.
The cap that will apply starting August 1, 2026, is based on the inflation index from April 2025 to April 2026. However, there are discrepancies in the data regarding which index to apply in the Bay Area, so I won't make a definitive statement here.
The applicable laws vary depending on the year of construction, number of units, whether it's a single-family home, and ownership type. If you have received a rent increase or notice, I recommend comparing the San Jose Housing Department's rent ordinance guidelines with state government resources.
There is also news on the supply side. In May, some land near the Berryessa BART station was sold for low-income housing development, and the Downtown Gateway Tower was introduced as a project to provide 220 units of low-income housing.
These projects may not immediately affect market prices. However, if supply increases near transit hubs, it could ease the rental market somewhat in a few years.
In summary, for those looking to buy a home, rather than rushing because interest rates have dropped to the low 7% range, it's better to first calculate the price adjustment and your monthly payment.
If you are an investor looking for rental income, you should first check whether the building is subject to city ordinances or state laws. The calculation of profitability differs based on that.
If you are a tenant, be sure to know the year your building was constructed. This one detail can significantly affect the allowable rent increase.
In my opinion, this is neither a market to rush into nor one to fear. If I were in your position, I would monitor interest rates and inventory periods until the end of the year and selectively choose properties with favorable conditions.
The transaction data for October will be released around mid-next month. Once the numbers are out, I will check again to see if this trend continues.
 AnovaSam





 Choco Choco Star |

 gentle |
 neapolis |

 moo moo |

 ultron78 |

 Tarzan's Joyful Imagination |

 U.S. Weather Bureau News |
 Living Economy Information Blog |

 Breaking Bad Drama |

 Time is GOLD |
 central |
 ssome |
 skykong |
 Shining Our Own World |
 gardener 007 |
 golfmaster |
 Nanana Nanana Nanana |
 Who's watching? |
 endone |
 RockStar |
 Casa Mia |
 You Only Live Once |
 Hardworking CPA |
 Joyce 77 |
 Runner Kim |
 My Town My Way Blog |
 My Miami Stories |
 Entip |
 Tony Park |
 Jean Claude Bundang Blog |