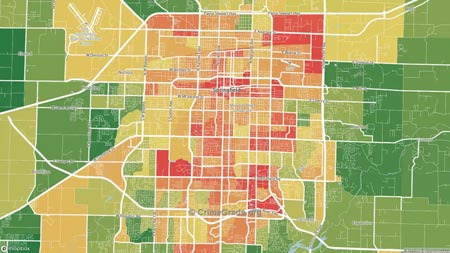
When examining crime data in Springfield, MO, by type, a much more detailed picture emerges than simply labeling it as a 'dangerous city.'
This summary of recent trends in homicides, vehicle theft, and property crime is based on FBI UCR data and annual reports from the Springfield Police Department. This data will help those considering moving or already residing in the area understand the actual level of risk.
Homicides: The annual number of homicides in Springfield averages between 20 and 30 from 2019 to 2023.
Considering a population of about 170,000, the homicide rate per 100,000 people is between 12 and 18, which is more than double the national average (around 6). The number of homicides was somewhat high in 2022, and there has been a slight decrease trend in 2023. Many of the homicide cases are classified by police reports as related to drug trade disputes, domestic violence, and gun conflicts. It is noteworthy that most incidents involve disputes between specific individuals rather than random victims.
Motor Vehicle Theft: Vehicle theft remains a consistently high crime type in Springfield. In 2022, approximately 2,000 to 2,400 vehicle thefts were reported annually, with the vehicle theft rate per 100,000 people estimated to be 3 to 4 times the national average.
Particularly, Honda Accords and older models of Kia and Hyundai (keyless entry models released before 2021) tend to be primary targets, which is a common trend nationwide. The main locations for these incidents are reported to be apartment complex parking lots, shopping centers, and public parking areas. The Springfield Police Department continues to recommend checking vehicle locks, storing valuables in the trunk, and using steering wheel locks.
Property Crime: Property crimes, including burglary, larceny-theft, and arson, are the most frequently occurring crime category in Springfield. In 2022, the total number of property crimes was around 10,000 to 11,000, which translates to over 6,000 per 100,000 people, significantly exceeding the national average (around 2,000). Among burglaries, commercial burglaries are relatively more common than residential burglaries. Larceny-theft is the most common type, primarily involving theft from unattended vehicles, shoplifting, and bicycle theft.
Recent Trends: Since 2022, the Springfield Police Department and city government have been implementing a 'Crime Reduction Initiative' that includes expanding CCTV installation, increasing patrols in hotspots, and community policing programs. As a result, a slight decrease in some crime types has been observed in 2023, but the overall crime rate remains relatively high compared to major cities nationwide. The Springfield Police Department publishes annual reports on its official site (springfieldmo.gov/police) and provides a near real-time incident map through CrimeMapping.com.
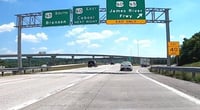
After selecting a neighborhood you plan to move to, it is advisable to enter the address into CrimeMapping or SpotCrime to check the types and numbers of incidents that have occurred in the last three months, and to compare whether the neighborhood's safety level is lower or higher than the overall city average. Even if the overall figures for Springfield are high, some areas in the southwest (south of James River Freeway) may show property crime rates similar to or lower than the national average, so detailed regional comparisons are key.
 Core81
 ChocoJoyful


 ramen |
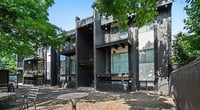
 selviro |
 KGOMIO Blog |
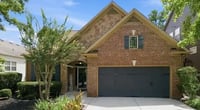
 Hardworking CPA |
 Freedom Yea |
 calvor |
 Investment Information News Update |
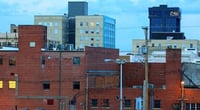
 Leapfrog Move |
  korvix |
  Eagle in America for Five Years |
  average life |
  All About Real Estate Information in the USA |
  Epoca News |
  Learn English Accurately |
  Tracking 60 Minutes News |
  RV Samuel's Dad |
  Bearded Strawberry Smoothie |
  Premium Gas Camp |
  My Life is High Breeze and Gentle Wind |
  Jean Claude Bundang Blog |
  Encyclopedia of New York and Surrounding Areas |
  American National Singing Contest |
  Diamond King |
  California Dreamer |
  Gupabal MissKorea |