
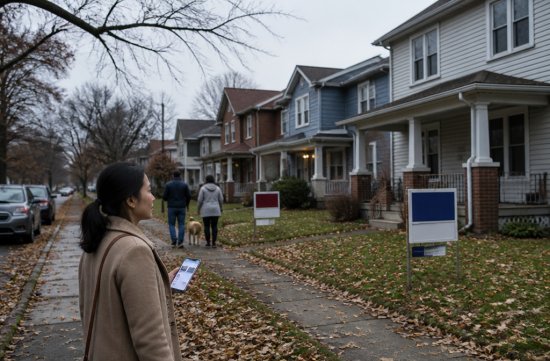
After October ended, I gathered data to summarize the Indianapolis market, but first, there's something to clarify. As of early November, the official figures for the month of October have not yet been released.
Therefore, this article will be based on the most recent month's figures available. Each number includes a reference point, so please pay attention to that.
To get straight to the point, home prices are mostly stagnant, and rents have not changed significantly either. However, with an increase in inventory, buyers are gaining a bit more negotiating power.
First, regarding home prices. According to Zillow, the representative home value within the city limits was $233,826 at the end of June 2026.
This is 0.5% lower than a year ago. While this isn't a large drop, it's noticeable that it diverges from the gradual increase projected at the beginning of the year.
At the same time, Zillow reported the median sale price at $242,508. The fact that the representative value and actual sale prices are not significantly different suggests that the market is relatively stable.
Here's where things can get confusing. When looking at the entire metro area, the numbers change dramatically.
According to Redfin's mid-year review, the median sale price for the metro area from January to June was $312,338, which is a 1.5% increase compared to the previous year.
The inclusion of northern suburbs like Carmel and Fishers raises the average. The reason home prices vary in different articles is mostly due to differences in the geographic scope covered.
For Central Indiana, which includes 16 counties, F.C. Tucker reported a median price of $300,000 in March 2026. This is a 0.3% increase compared to the same month last year, indicating that prices are essentially stable.
So why are prices stagnant? The most significant changes in the recent market are seen in inventory.
According to the same F.C. Tucker data, inventory in March was 22.1% higher than a year ago. Redfin's mid-year review also noted that active listings increased by 10.5% to 9,754.
In contrast, the number of transactions was only 2,705, reflecting a mere 1.9% increase. This means that the pace of increasing inventory is outstripping the pace of sales.
However, this doesn't mean that homes aren't selling. According to Redfin, the median days on market for listings in April was 24 days, while Zillow reported a median of 14 days for contracts as of June.
Well-priced homes in good locations still sell quickly. However, homes priced too high are staying on the market longer and often end up reducing their prices.
The increase in price reductions signals that sellers are adjusting their asking prices based on market reactions. From a buyer's perspective, there's an opportunity to negotiate repair costs after inspections.
Now, let's talk about rents. There can be significant discrepancies in rental amounts depending on the source, so it's easy to misunderstand if you only look at one number.
According to Trulia's monthly data, the average rent in October 2025 was $1,500, and in July 2026, it was $1,498. This indicates that rents have essentially remained unchanged for nearly a year.
Data from Zillow's rental index shows that the average asking rent in May 2026 was $1,553, which is a 2.3% increase compared to the previous year.
Trulia's figures are closer to actual registered listings, while Zillow's index tracks changes in asking prices for similar types of homes. Although the methods differ and the amounts vary, both indicate that there hasn't been a significant surge.
For reference, the fair market rent set by HUD for 2026 is often cited as $1,473 for a two-bedroom unit. It's important to note that this is not the market average but rather a government assistance benchmark.
From an investment perspective, this combination is quite interesting. Home prices have stalled, rents have also stabilized, and buyer negotiating power has slightly increased.
It seems prudent to lower expectations for capital gains in the near term. However, if you can negotiate a good purchase price, achieving rental yields may be easier than last year.
For those moving from out of state, I recommend checking the geographic scope first. The mid-range of $200,000 within city limits and over $300,000 in the northern suburbs represent completely different markets.
If you're considering the Hamilton County area based on school districts, be prepared for prices that are higher than the metro average. If you have the same budget, expanding your search within the city may also be a realistic option.
For those planning to settle in through renting first, now is not a bad time. With rents having been stable for nearly a year, there's room to negotiate increases upon renewal.
If it were me, I wouldn't rush this winter. As we enter the off-season, more homes are taking longer to sell, and those homes tend to have the greatest potential for price adjustments.
The official October figures will be released sequentially on MIBOR, Redfin, and Zillow research pages. Once the numbers are out, I'll summarize whether this trend continues.
To summarize based on current conditions, prices are holding steady, inventory is increasing, and the rental market is taking a breather. It seems like a good time to wait and observe the numbers rather than rush into action.
 SunFullJoy
 StrangeDogWlk








 B.I.G. Victor |

 Amber H |
 uplifted |

 Dr. Kelso |

 silents |

 nagaduri |

 Gomo Nim |

 Indiana Jones |

 OMG Indiana YO |

 yolo1990 |
 action blog 101 |
 athome blog |
 calvor |
 Haha and Bomi Blog |
 Lee Ton |
 viba viba |
 Olivia's Blog |
 208 Master |
 crumb |
 blanke |
 Burbank Lee |
 tervox95 |
 silverado |
 Grow Your Gut Bacteria Well |
 Kim You Shin |
 Squid Q |
 gelatonew |
 river9 |
 ttano |
 Eagle in America for Five Years |